Newsmart grid network analytics
Your monitoring shows it went down. GridSys shows where it started.
Health of every radio, DCU and Access Point, the likely origin of every outage and the radios that will fail in the coming days. On top of the Zabbix you already run, read-only.
A product by
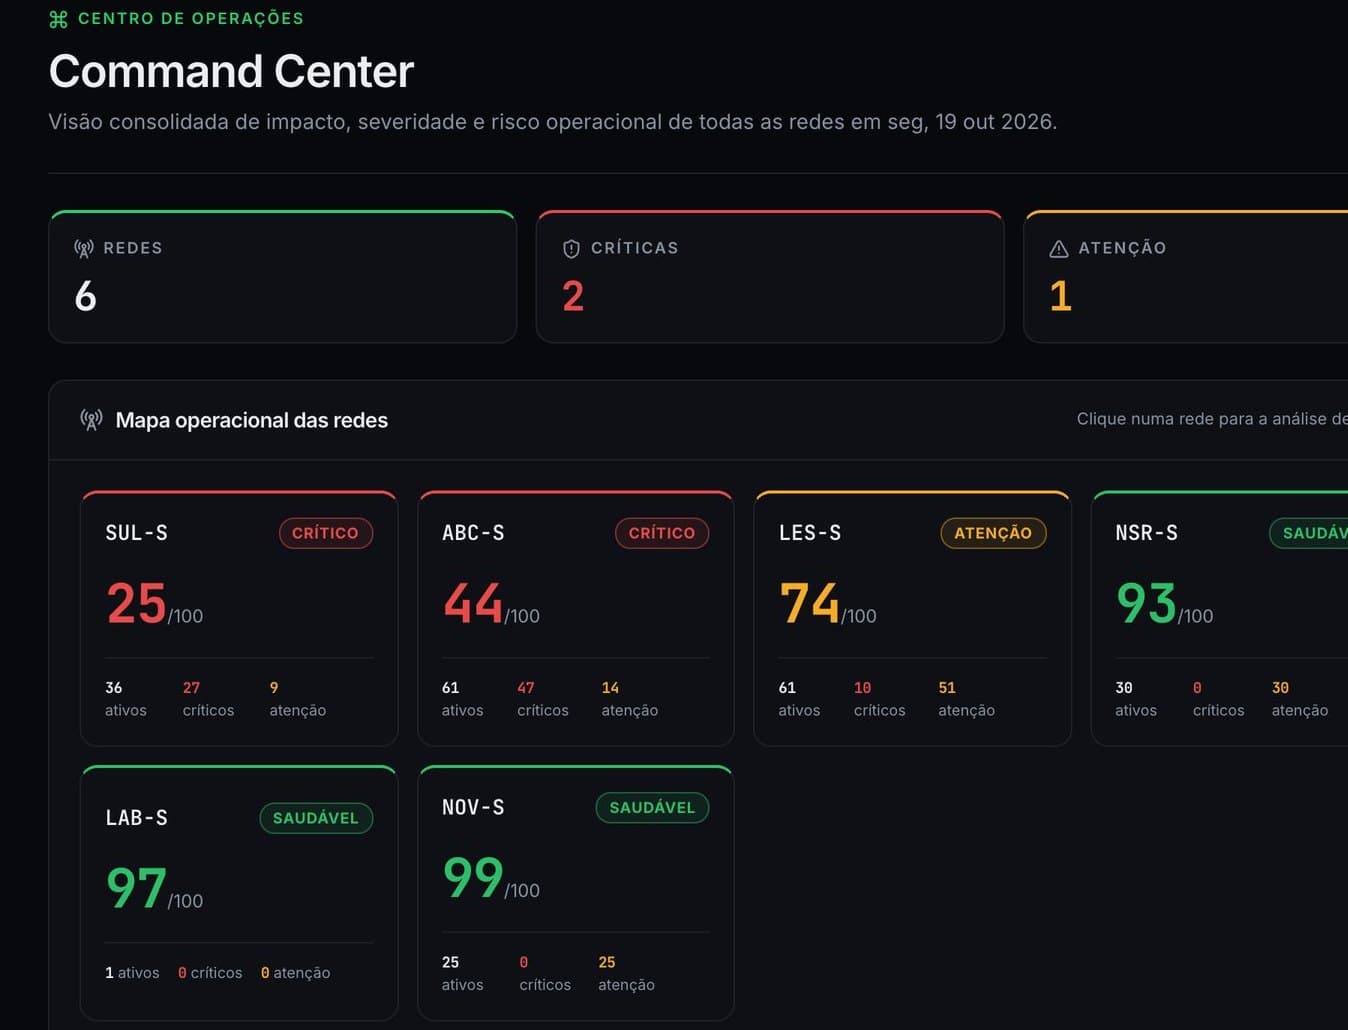
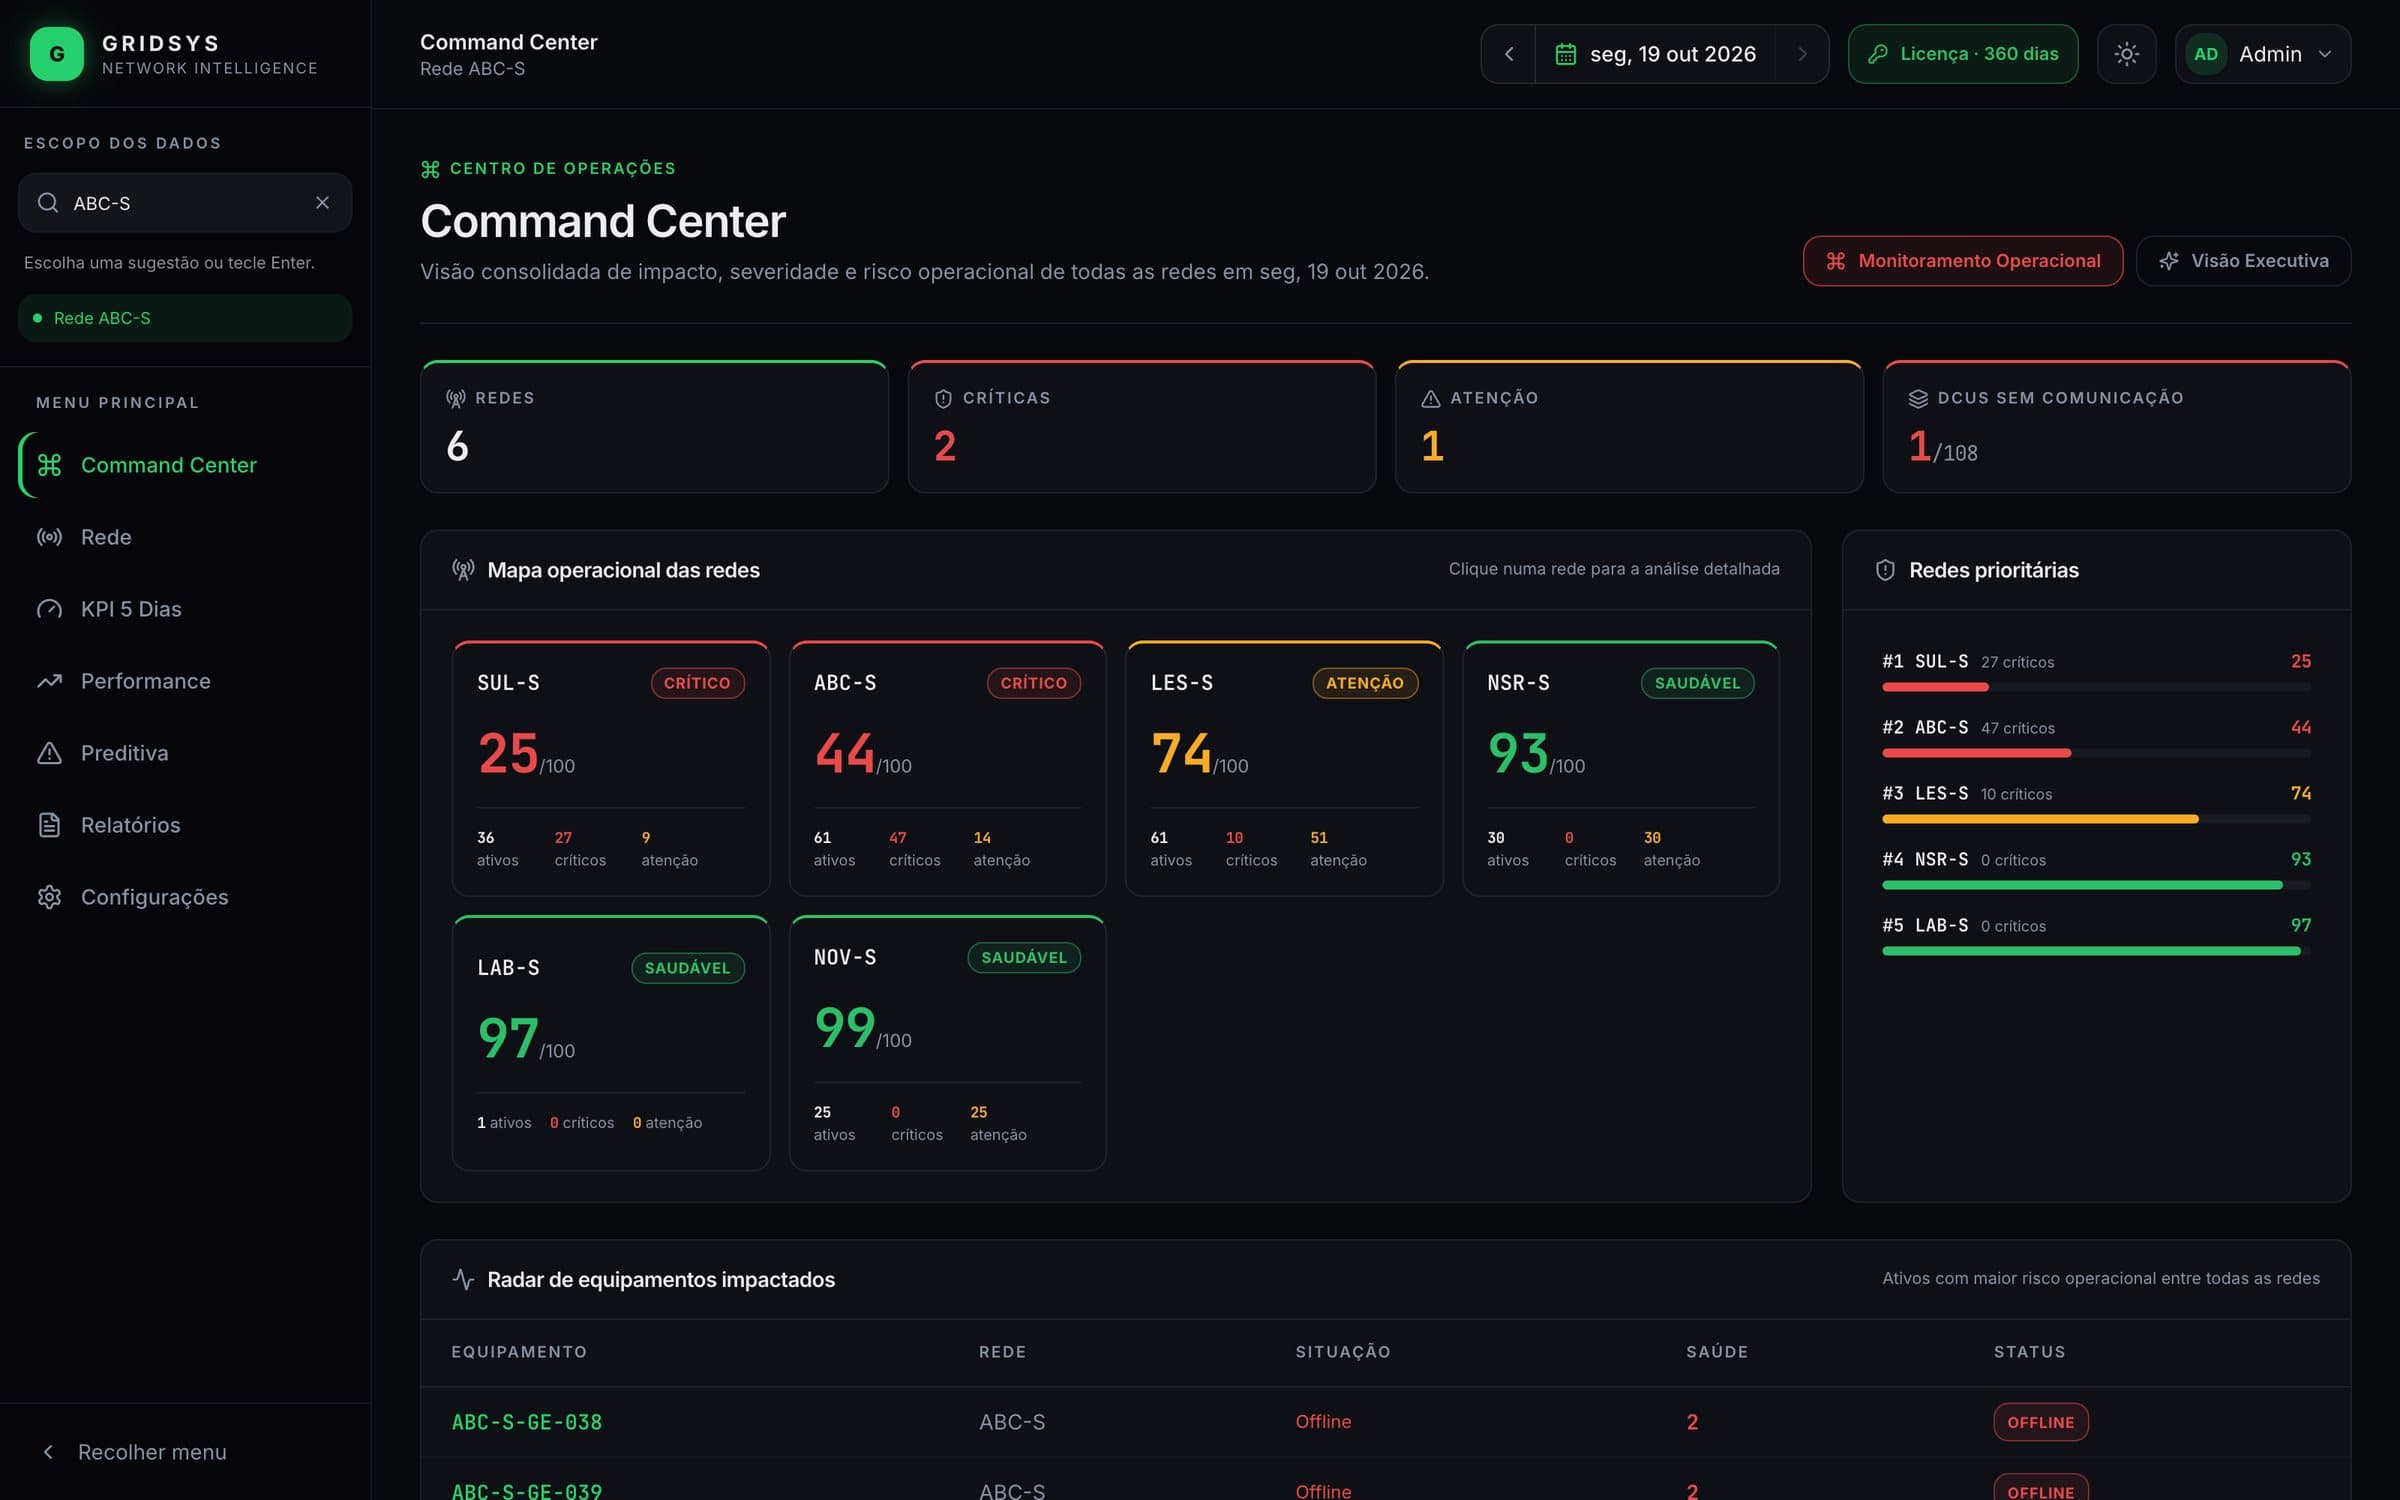
GridSys Command Center: six networks with a 0 to 100 health index, priority networks and DCUs without communication.
Works with what your operation already uses
 MDS Orbit



 Docker
A repeater stops responding.
The DCU behind it is cut off and the meters stop reading.
The dashboard lights up with 30 red hosts.
Which one do you send the crew to first?
Every outage has an origin. GridSys points to it.
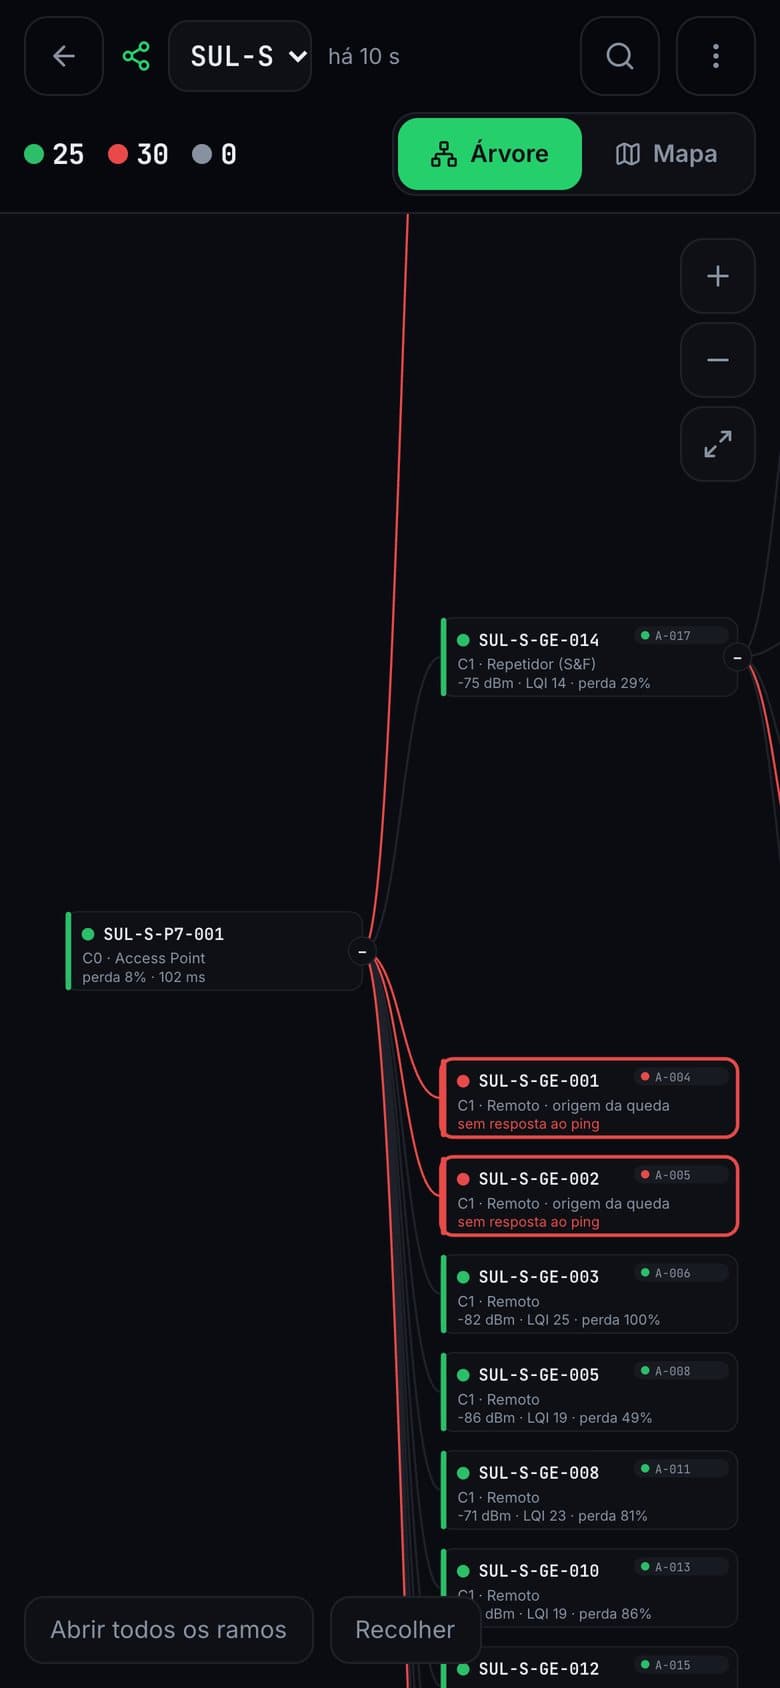
The diagram rebuilds the path from the Access Point to the last hop using what the radios themselves report, as a tree or on a satellite map. When a branch stops responding, the radio where the failure started is highlighted, and you see right away what depends on it.
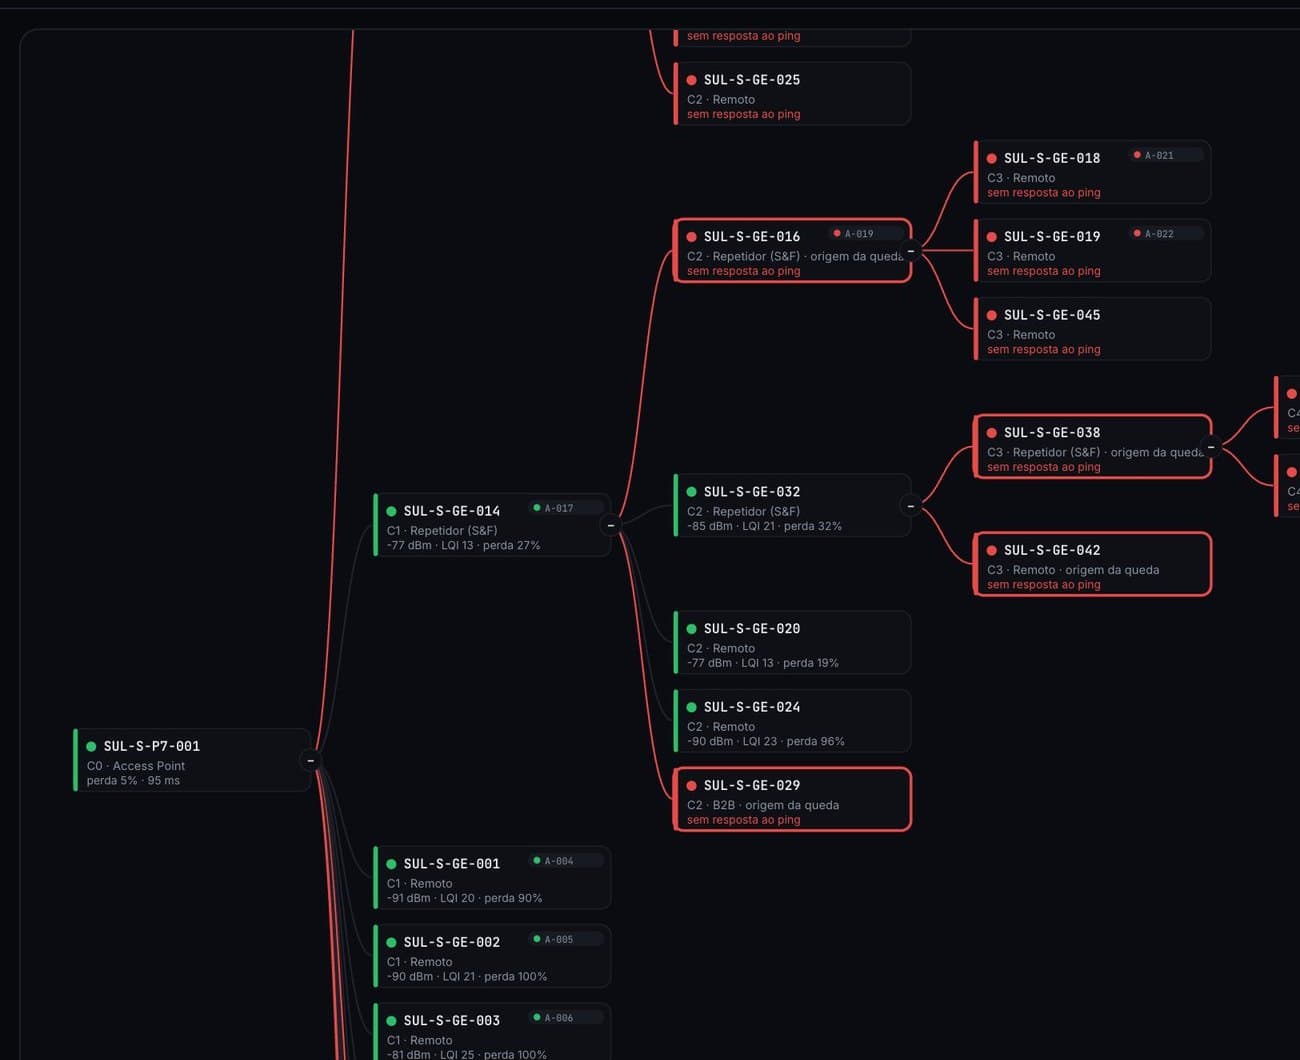
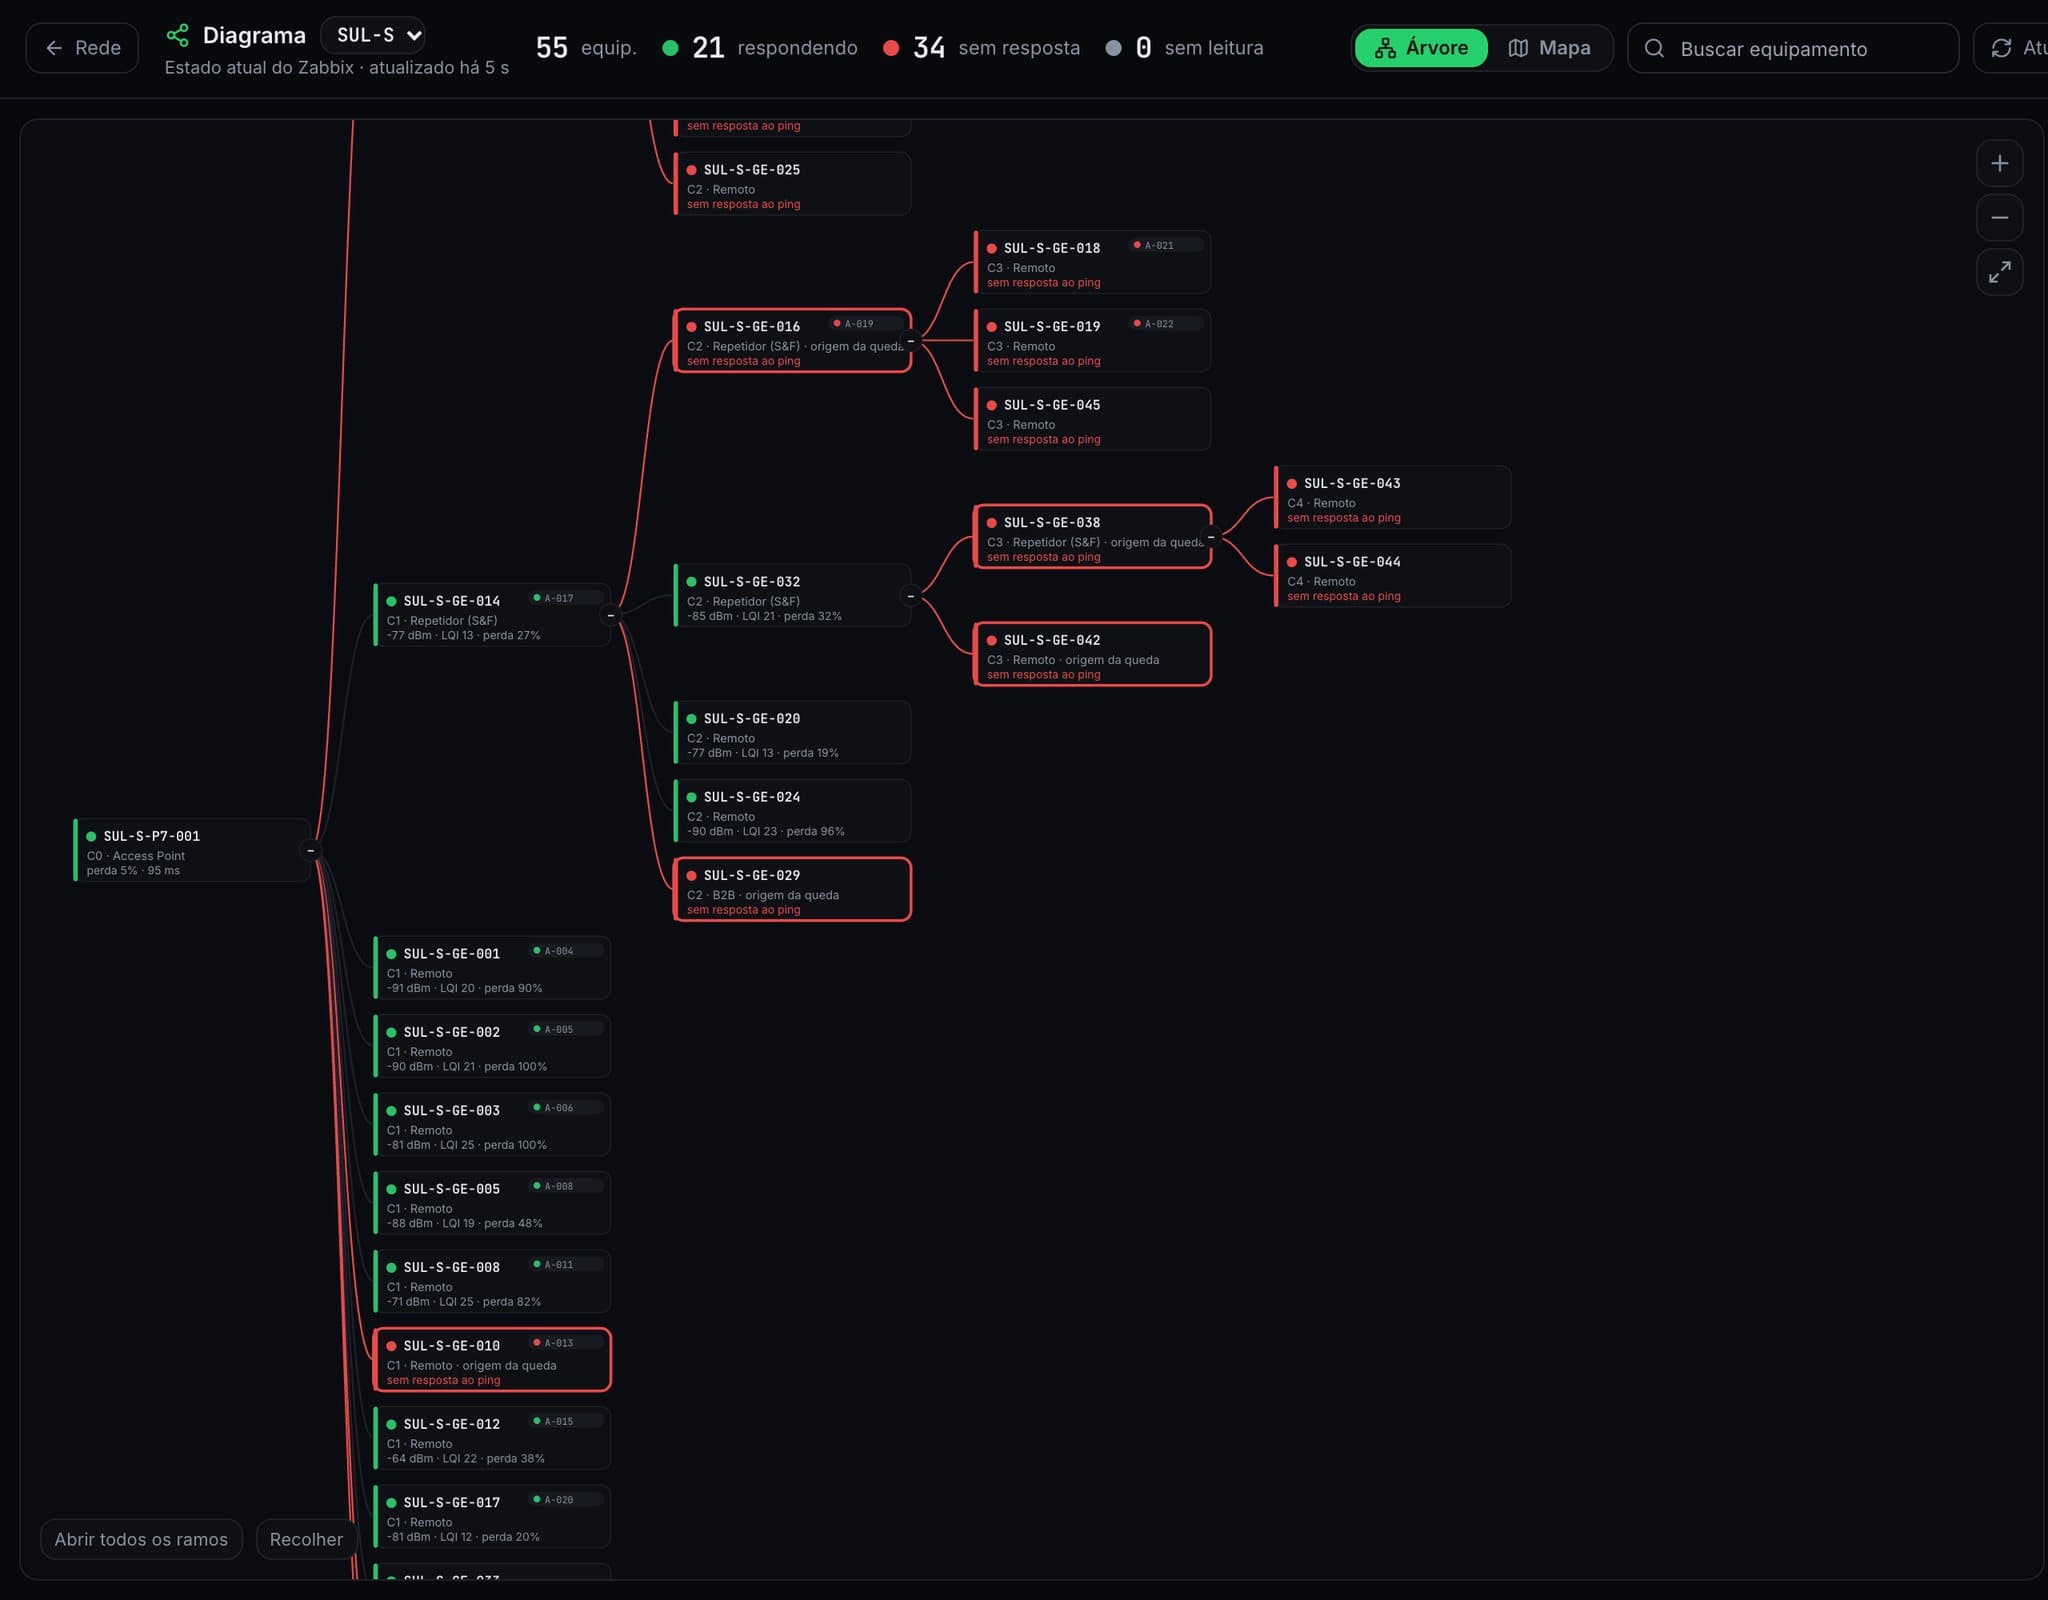
- 1Access Point responding
- 2Likely origin: the one above responds, this one does not
- 32 radios went down with it
- Rereads Zabbix every minute
- On-demand fresh collection in about 20 seconds
- 3D satellite map, with links colored by state
Every network, in order of what needs you today.
Health index per network, DCUs without communication and the radar of the most critical devices, with the reason written next to each. The executive view has availability, loss, root cause and compliance ready for the results meeting.
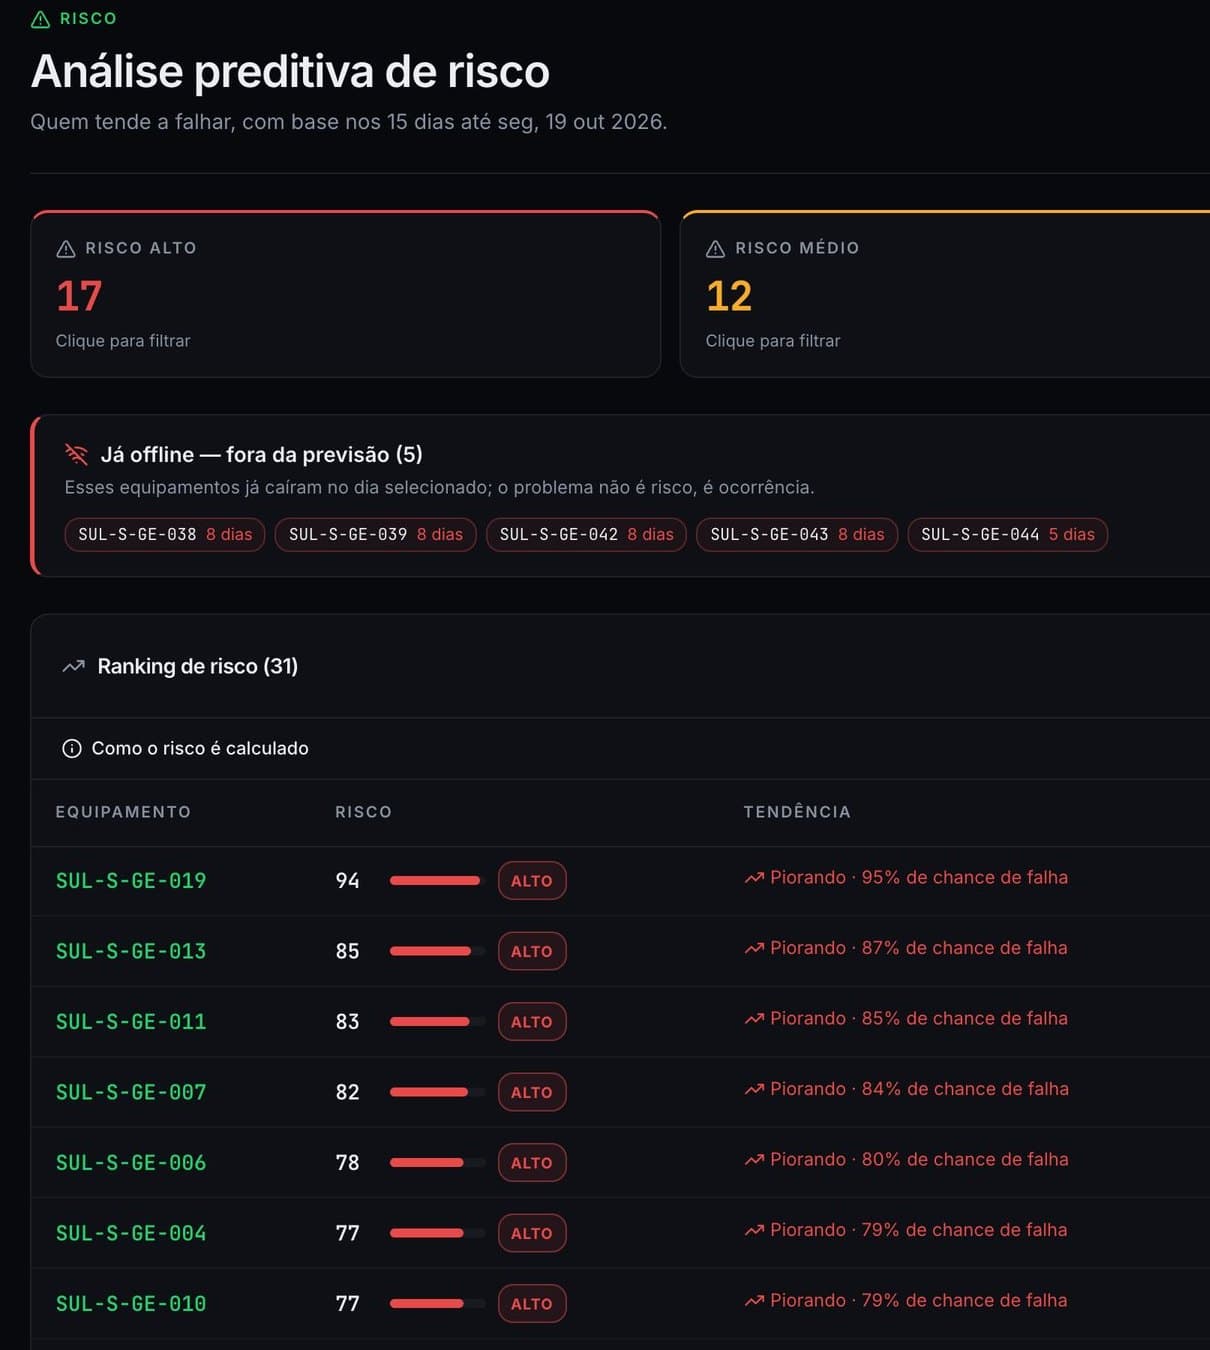
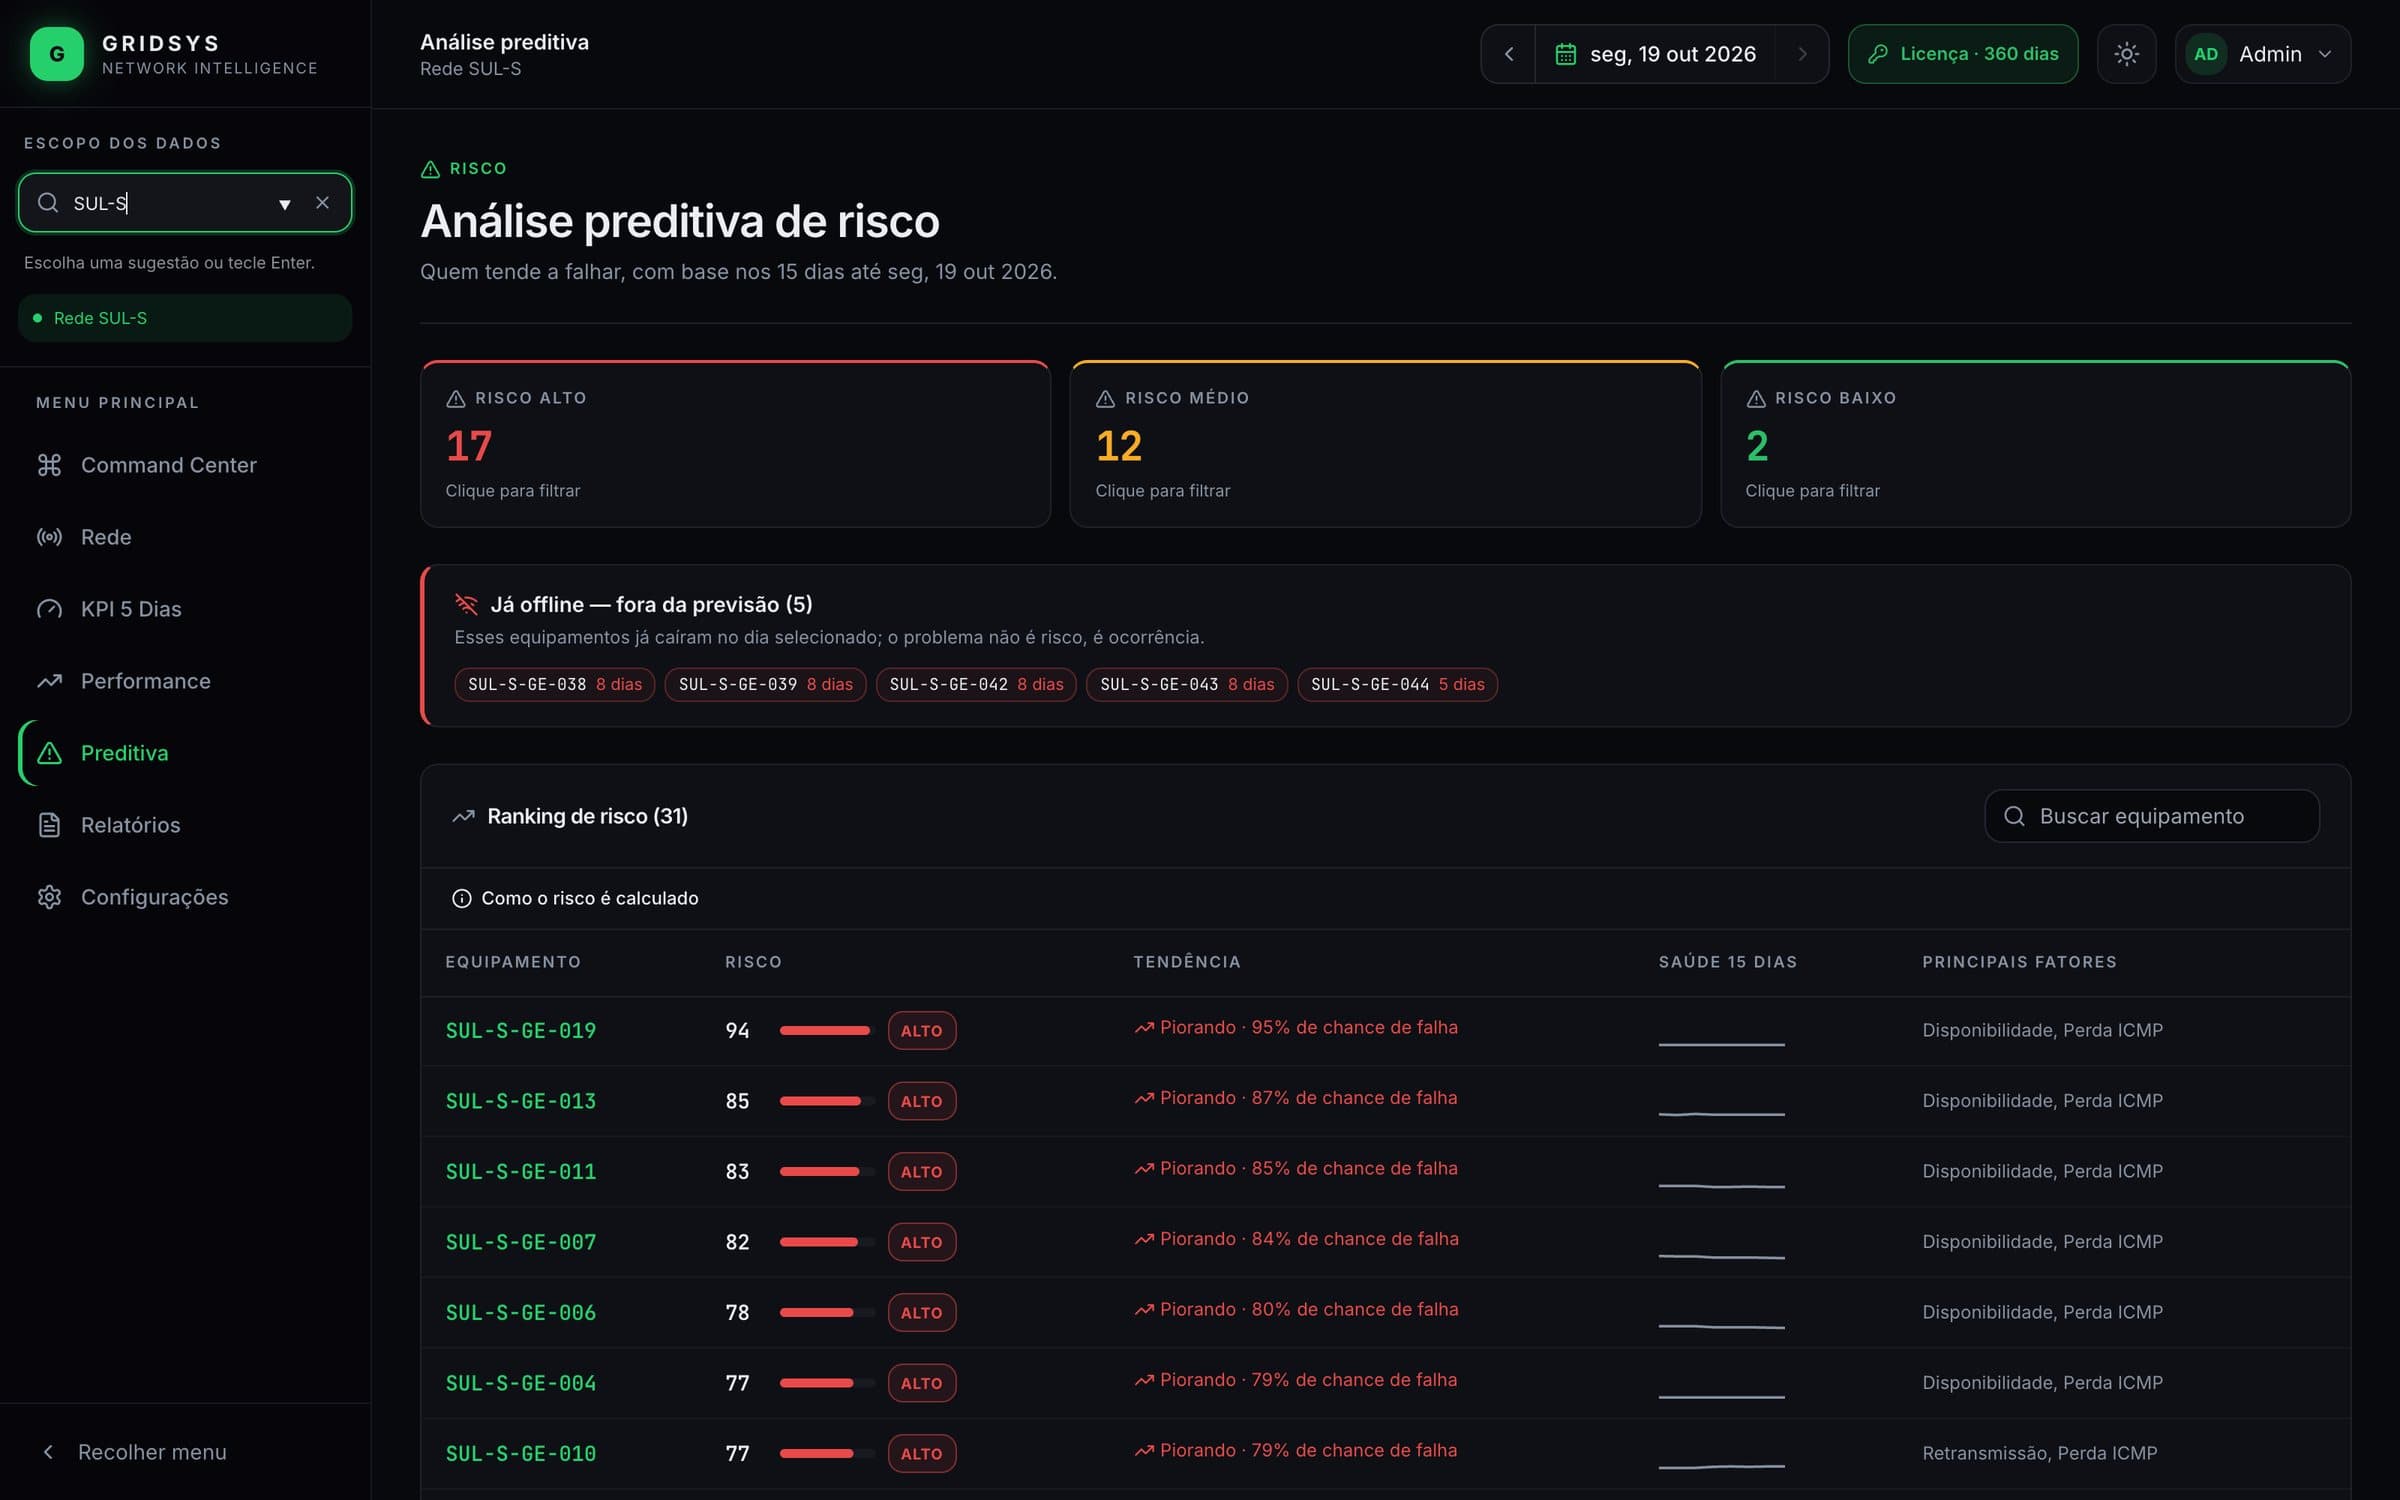
The radios that will go down this week are already getting worse.
The predictive analysis looks at the last 15 days of each radio: how close it is to the critical limit, whether it is getting worse and how much it fluctuates. The result is a risk ranking with the estimated chance of failure, so the field visit happens before the outage.
Radios that have already gone down leave the forecast and become incidents.
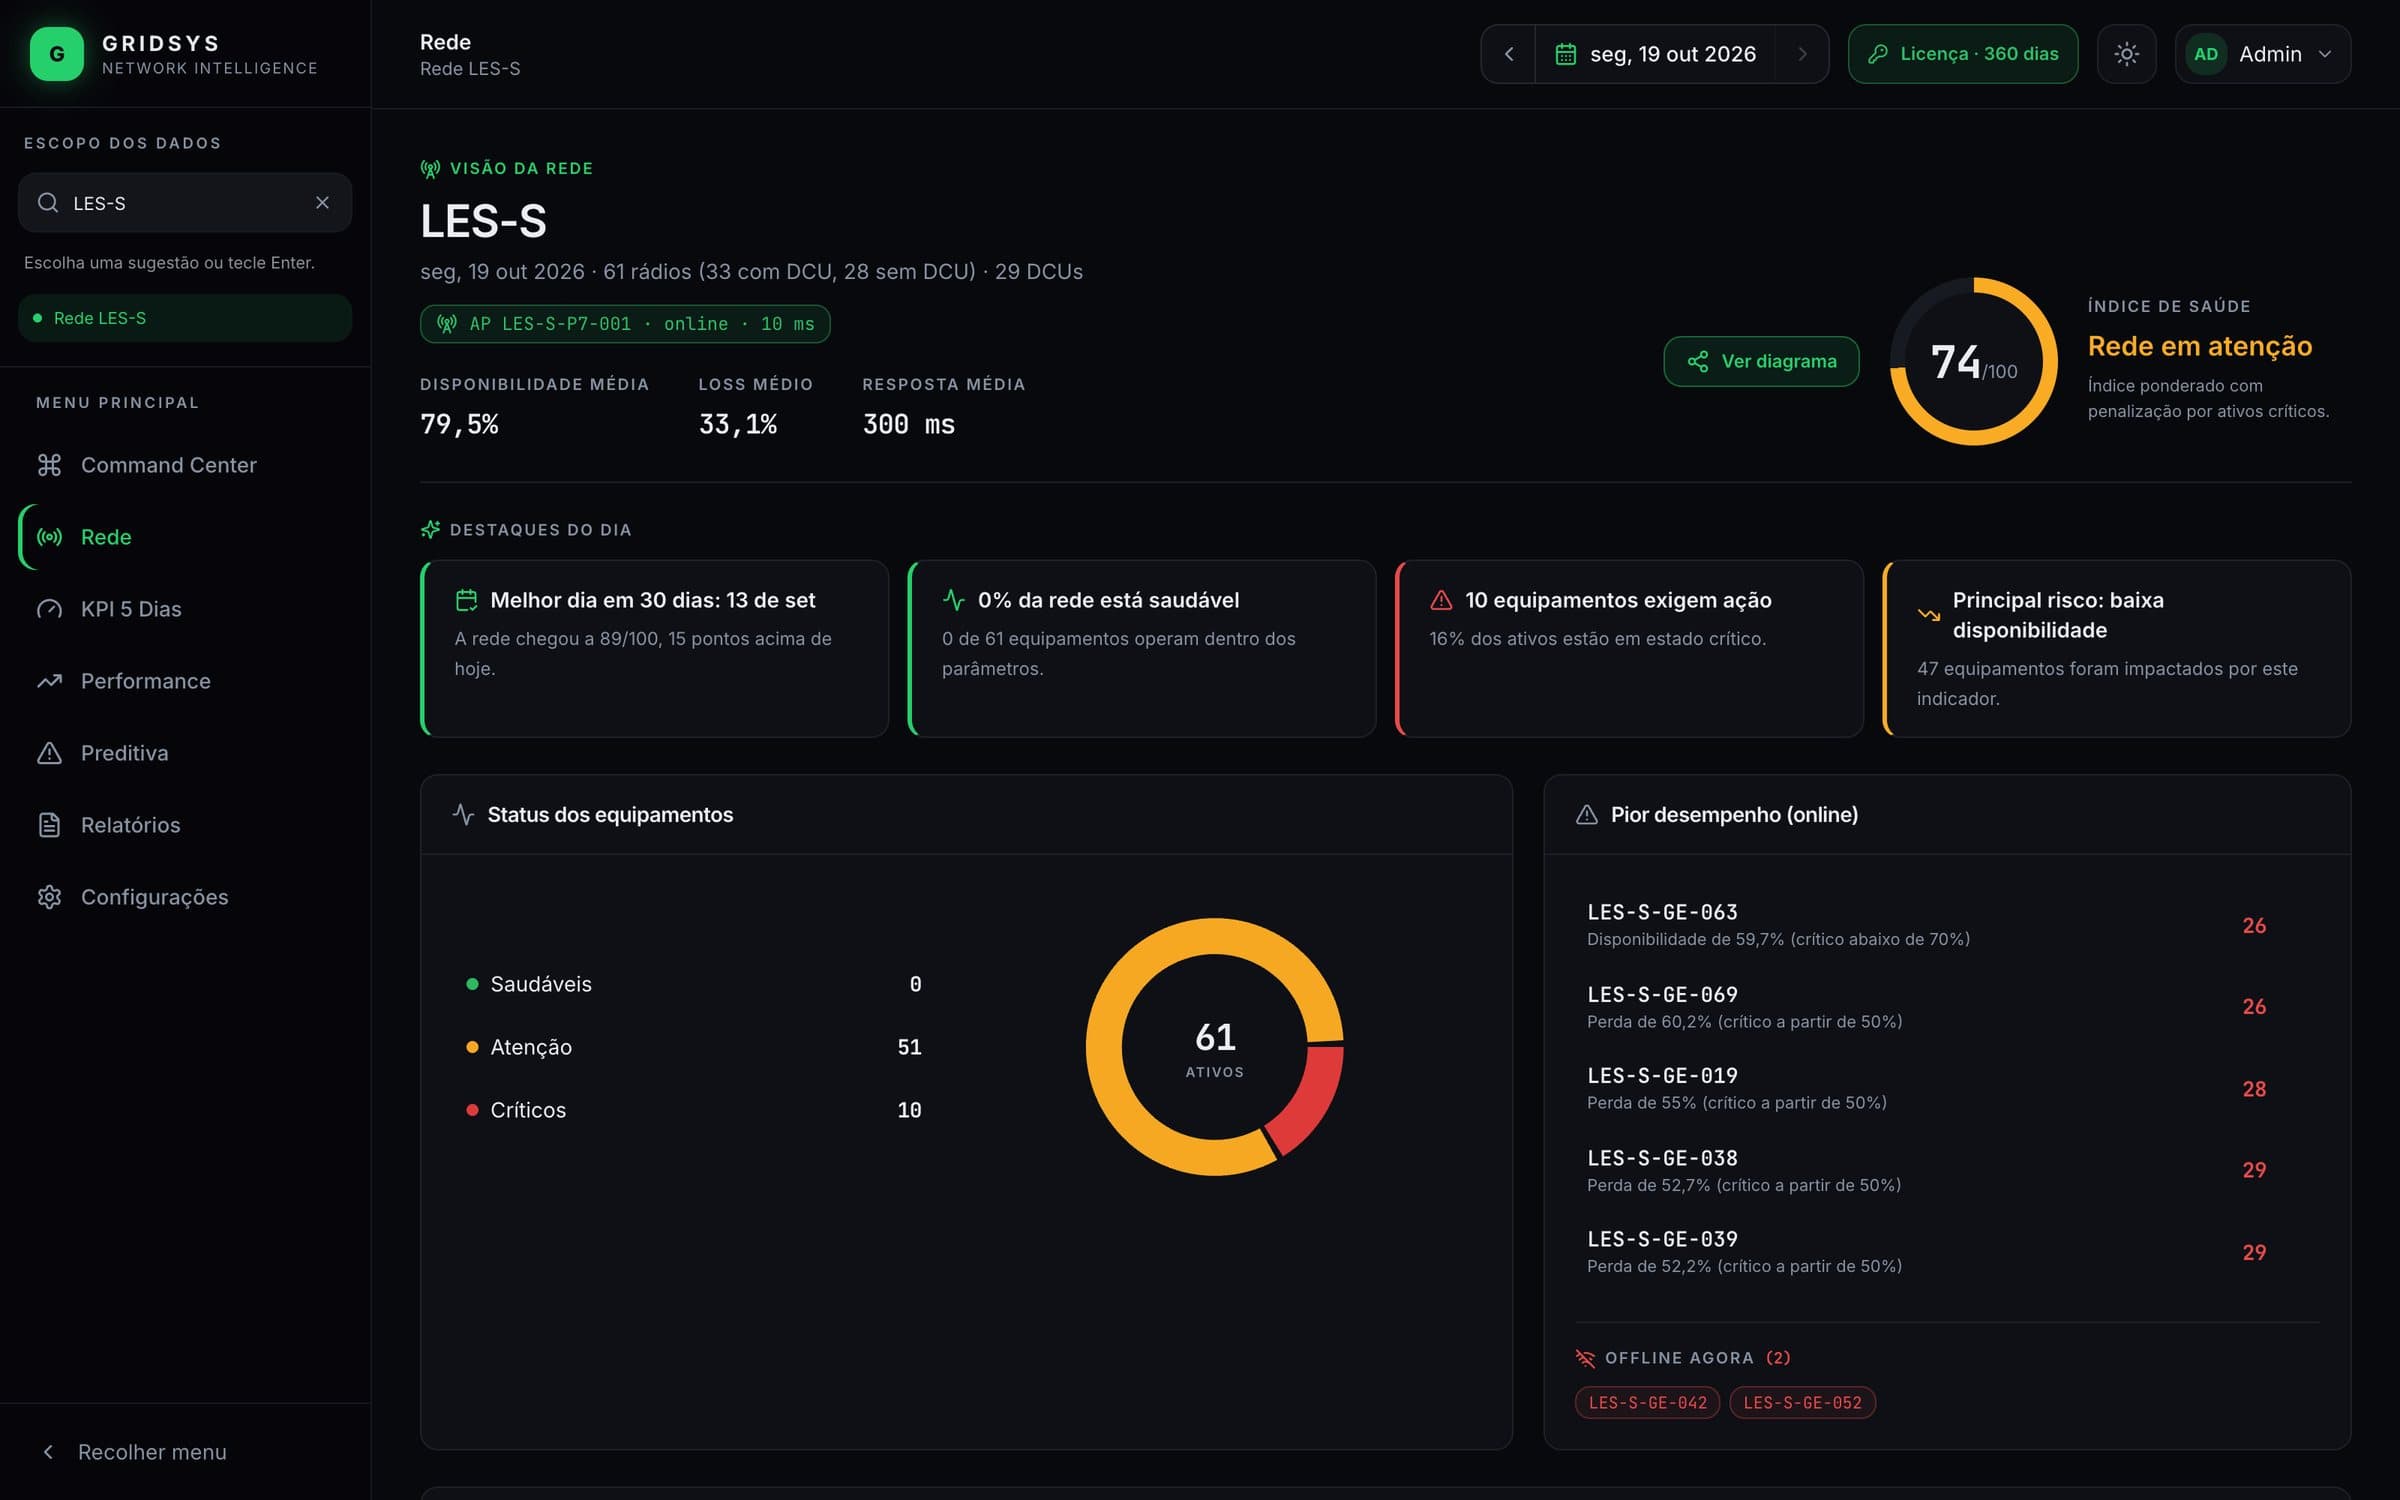
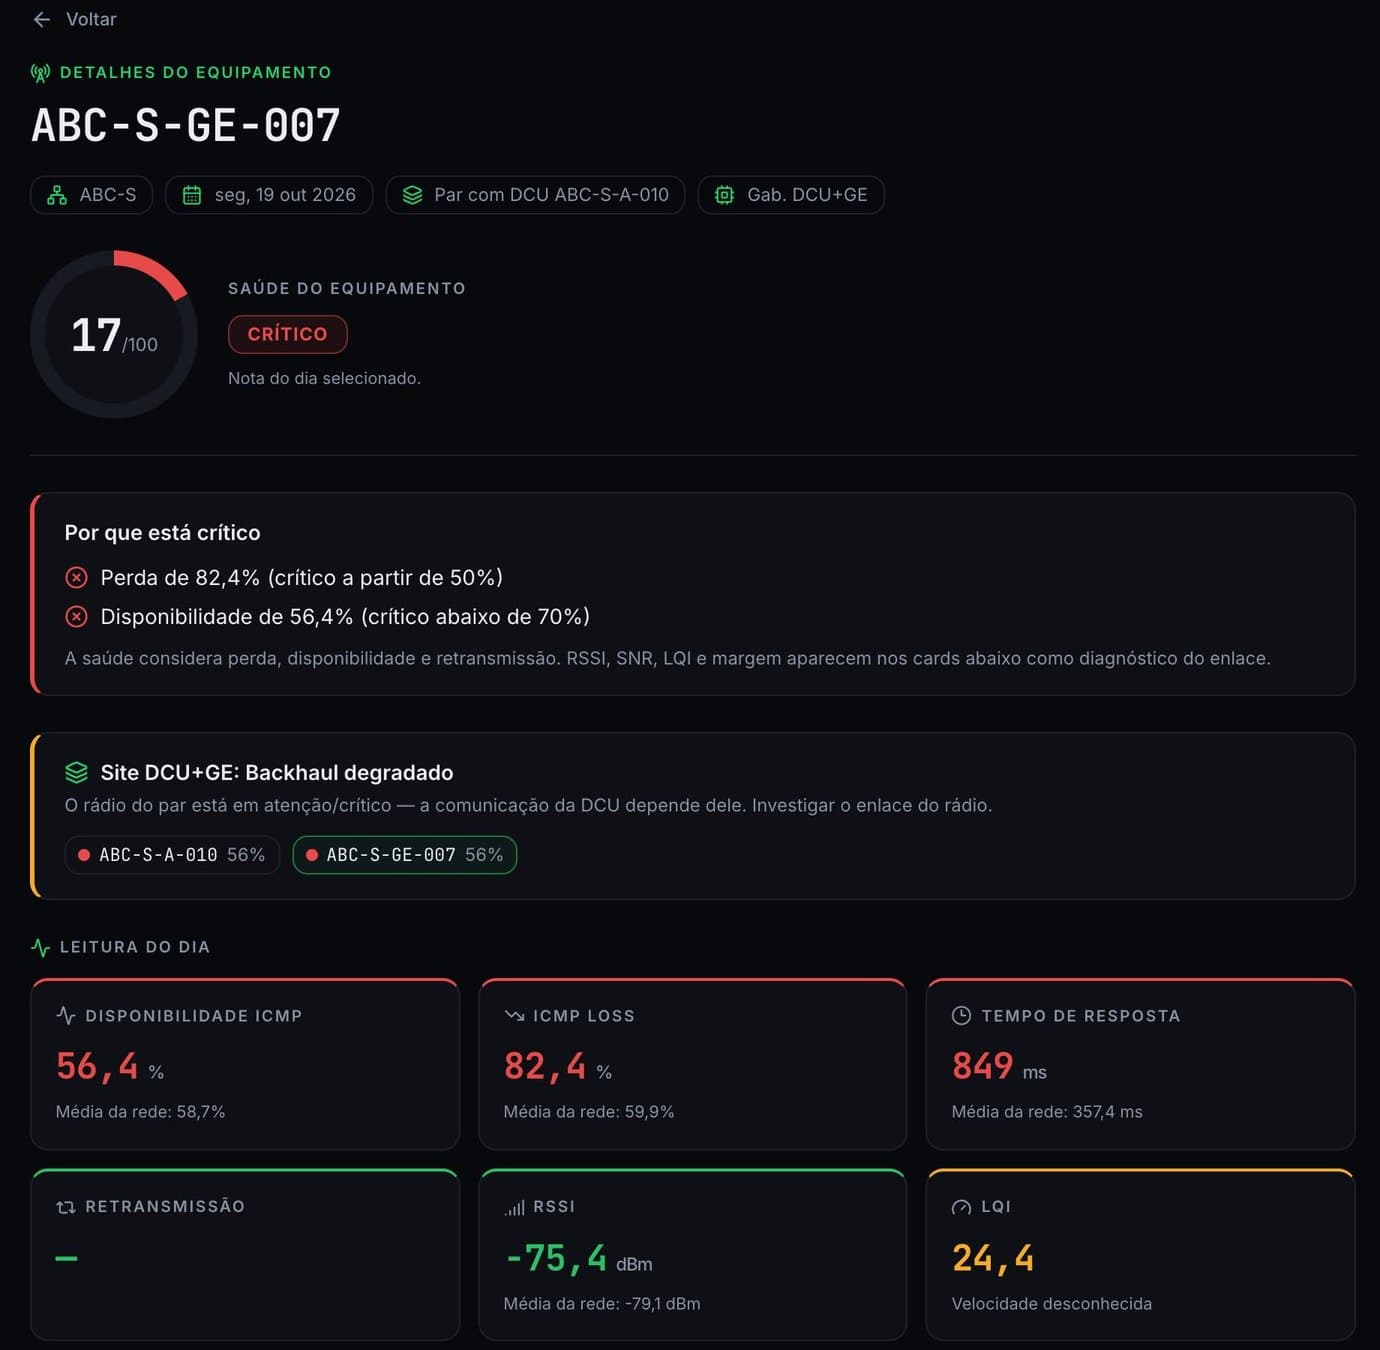
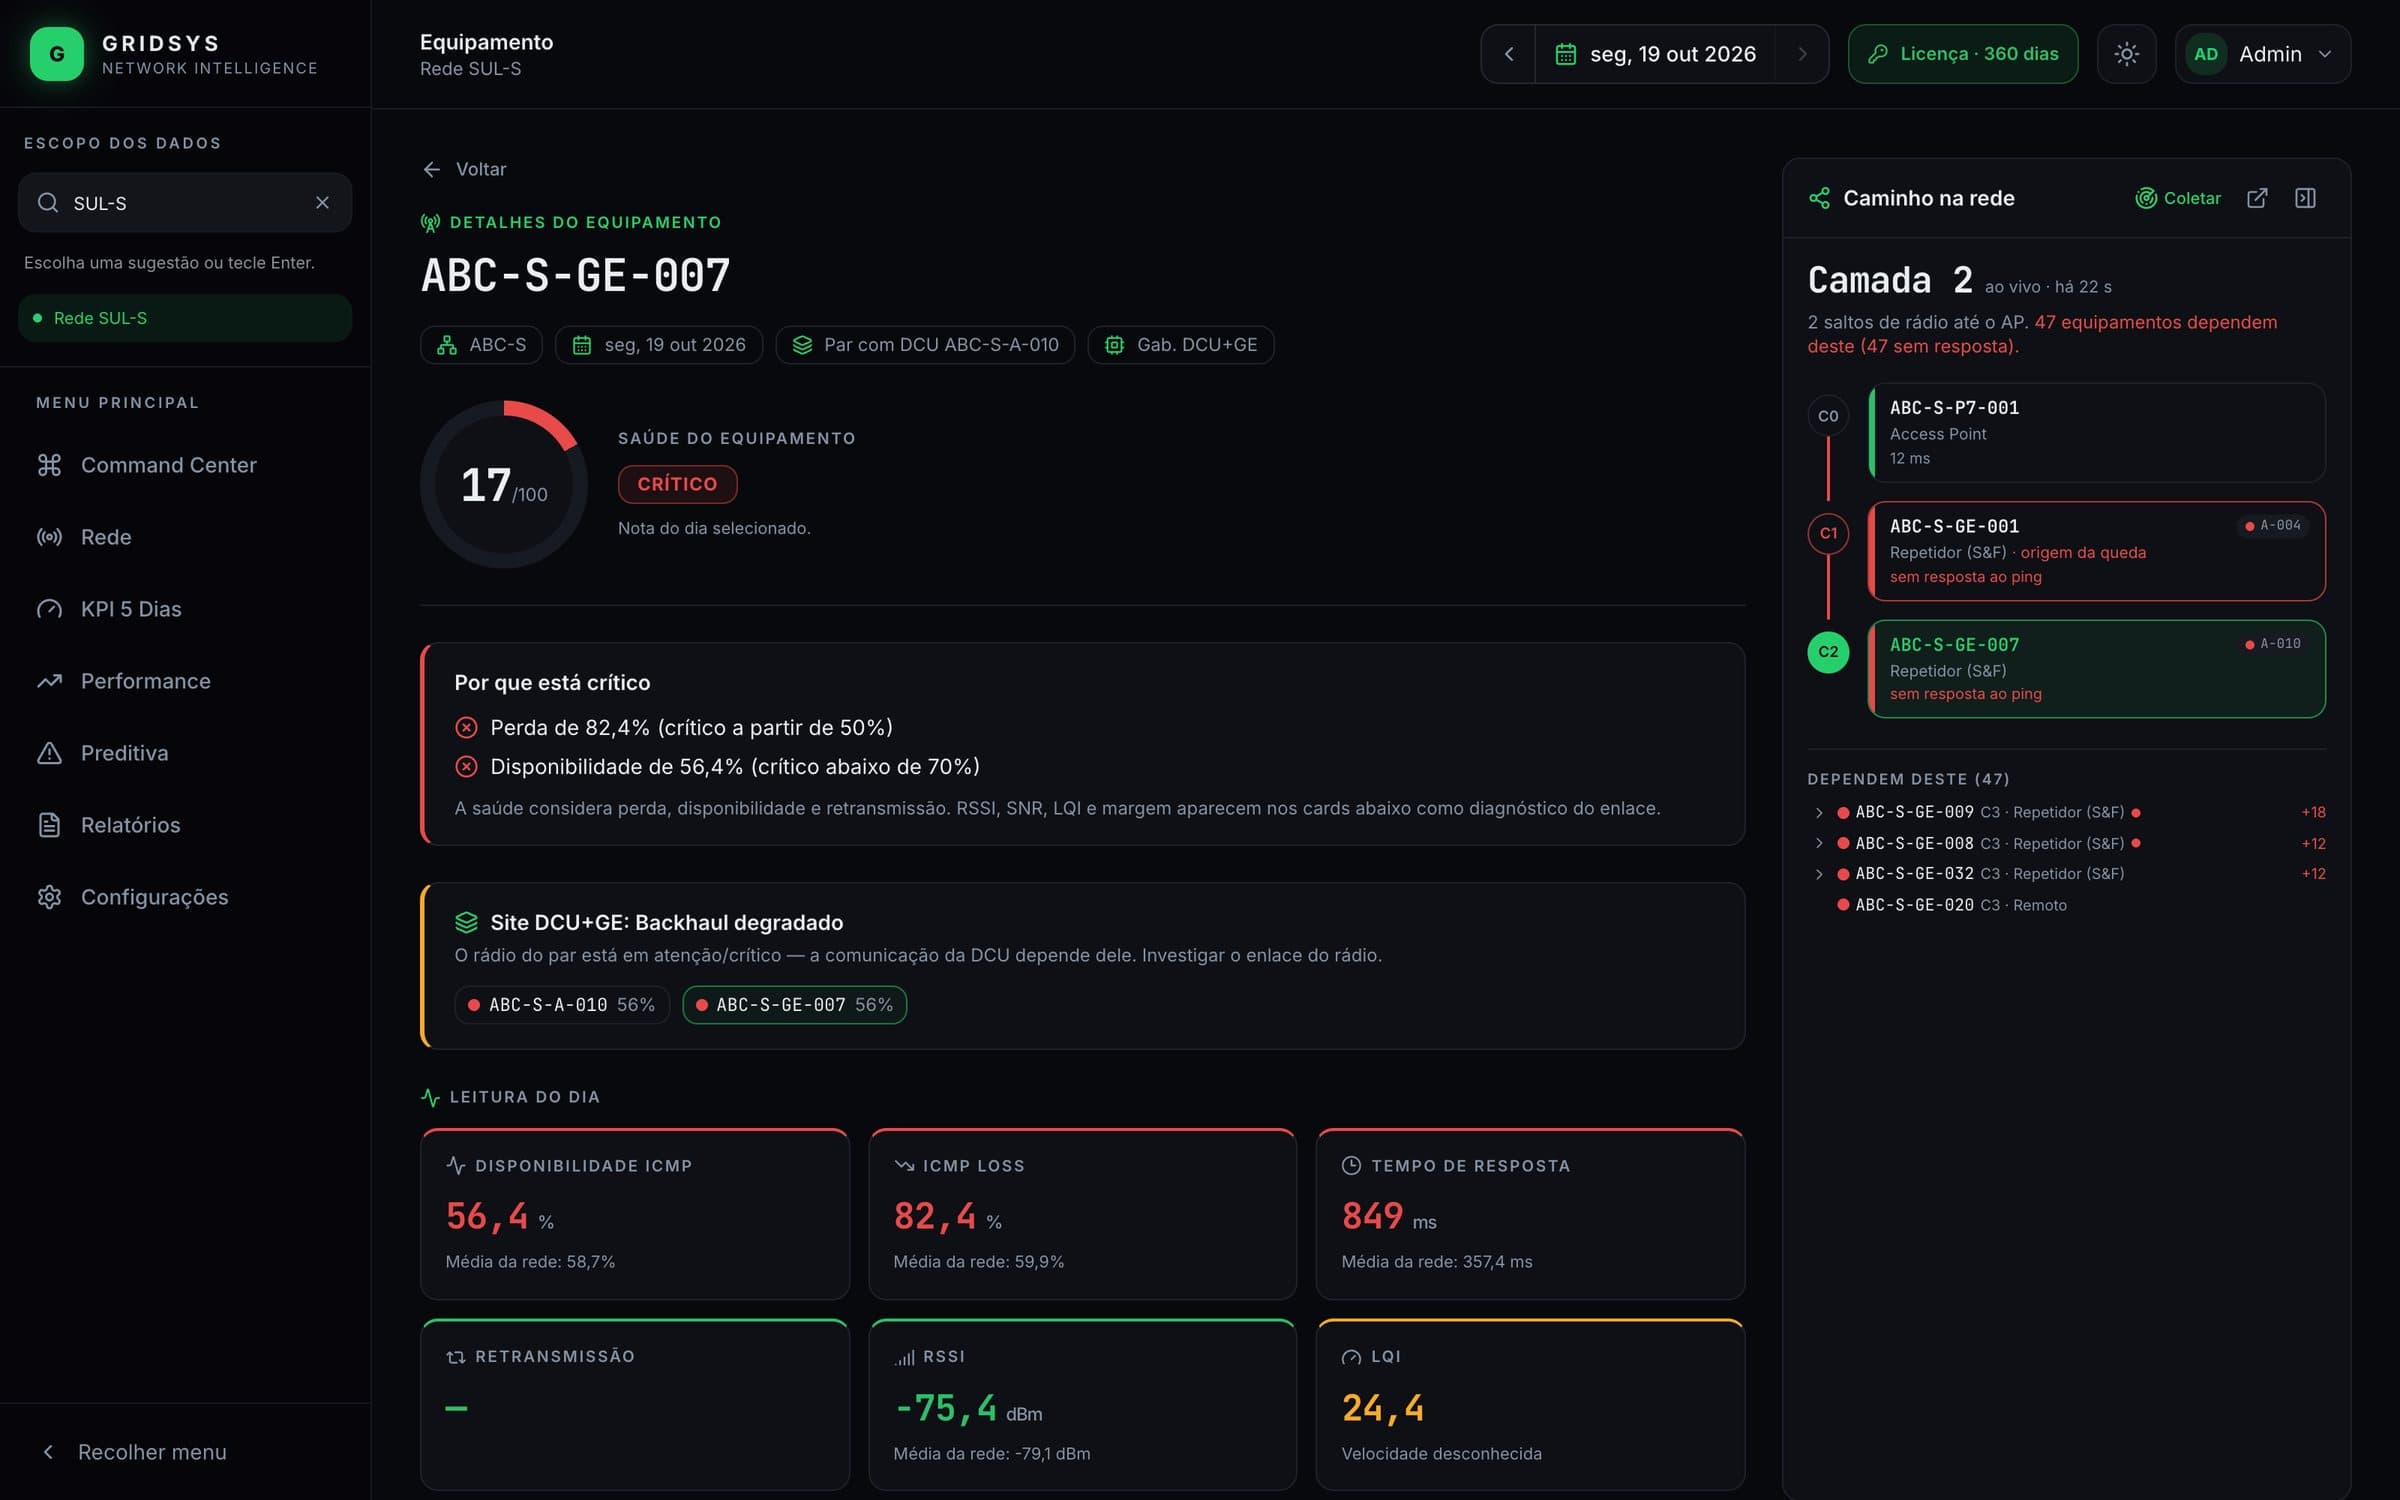
One radio. The full diagnosis, in plain language.
- 01Why it is critical
- The reasons in plain text, compared with the network average on the same day.
- 02Link reading
- LQI, fade margin and VSWR based on the GE MDS Orbit technical manual.
- 03DCU+GE site
- Whether the DCU is cut off, whether the failure is in the DCU or the backhaul degraded.
- 04Path through the network
- Layer by layer up to the Access Point, and everything that depends on this radio.
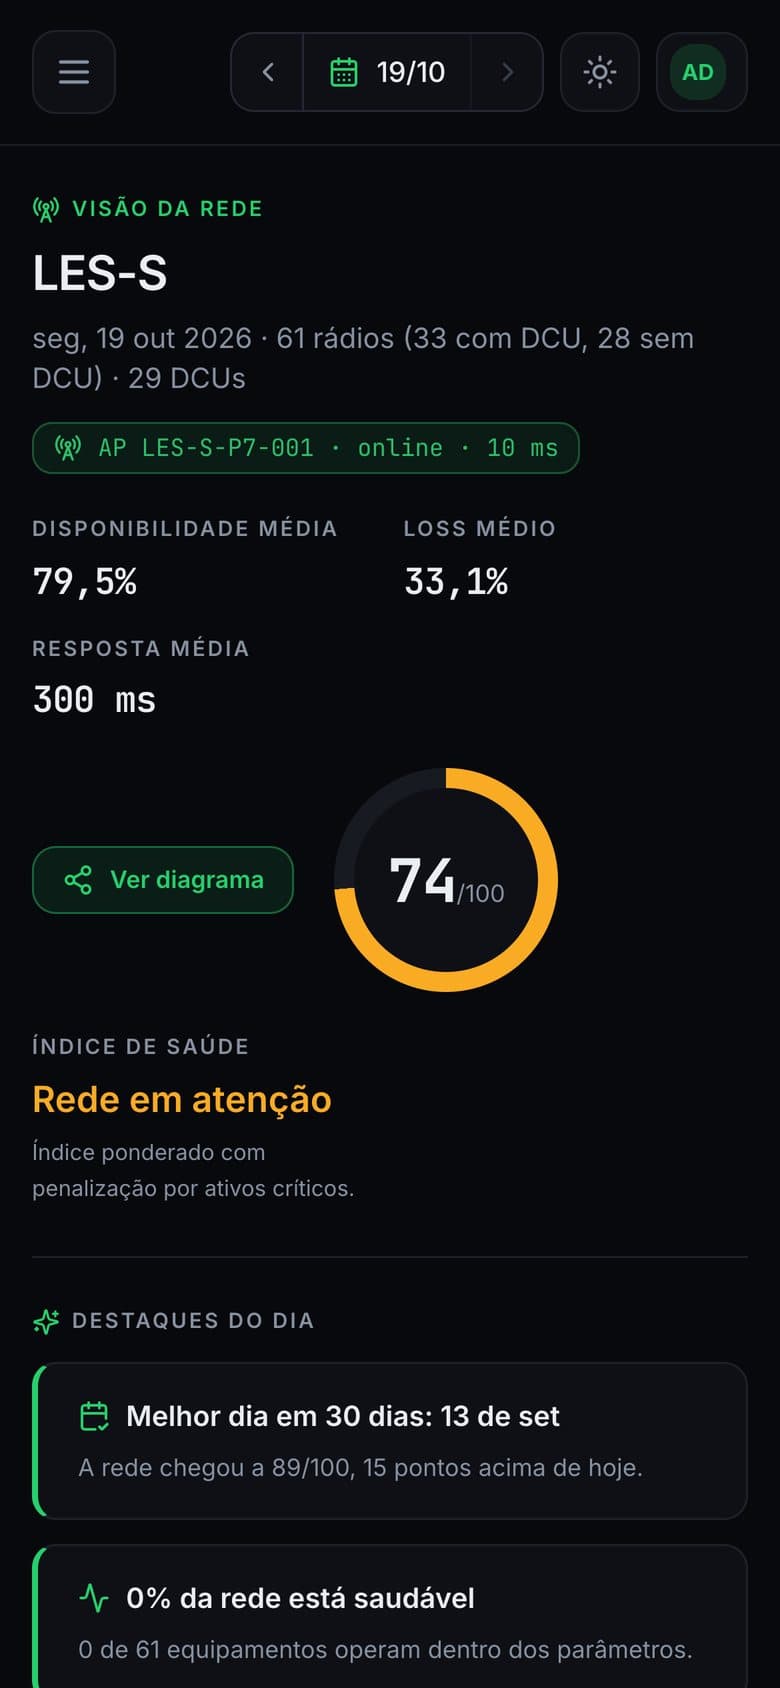
In the pocket of the field crew.
GridSys installs as an app on the phone. Diagram with gestures, a search that makes the radio blink on screen and the history of interventions logged in GridOps, with photos.
Your IT team signs off in one meeting.
GridSys was built to go into a utility without asking for a security exception.
- 1Import the collection template into Zabbix
- 2Create a read-only user with an API token
- 3Start the container
| What it accesses | The Zabbix API, with a read-only user. Never the devices. |
|---|---|
| What it writes | Nothing. It does not create hosts, items or triggers in Zabbix. |
| Where it runs | On your server, next to Zabbix. No internet; the license is validated offline. |
| How you log in | With the same Zabbix username and password. |
| What gets installed | A container of about 25 MB, no shell and no root. No new database. |
| What it uses | 2 vCPU and 2 GB of RAM handle a few thousand devices. |
Common questions
Do I need to replace my monitoring?
No. GridSys runs on top of the Zabbix 7.0 or later that you already operate. Alarms, triggers and collection stay in Zabbix.
Which technologies are supported today?
GE MDS Orbit radios (NX915), with the Access Points, repeaters, B2B pairs, DCUs and DA switches they serve. If your network uses another technology, tell us in the demo.
Where does the link between radio, DCU and DA switch come from?
From GLPI or a registration spreadsheet. GridSys reads that link to diagnose the DCU+GE sites and identify the switches by number.
Is the data on the screens of this page real?
The screens are from the real application, running in our lab with simulated networks. No customer data appears here.
Who develops GridSys?
Grid Educação, which trains professionals in smart grid networks. GridSys was born from the same field experience: radios, DCUs, backhaul and day-to-day operations.
How does licensing work?
By license file, with an expiry date and a device limit. The proposal is sized to your network.
Smart grid specialists
Want to turn your network data into results?
Get in touch and talk to our smart grid specialists. We show GridSys running and look with you at your architecture, your Zabbix and where your operation can gain.
- 1You tell us about your network
- 2You send it on WhatsApp and we reply to set a time
- 3A guided demo, with room for your questions